
In Experlogix, logging is a mechanism for recording the incoming and outgoing requests between Cloud Connect and the Configurator. It also helps provide insight into information processing in Microsoft Dynamics 365 CE, which is especially useful for design and troubleshooting purposes.
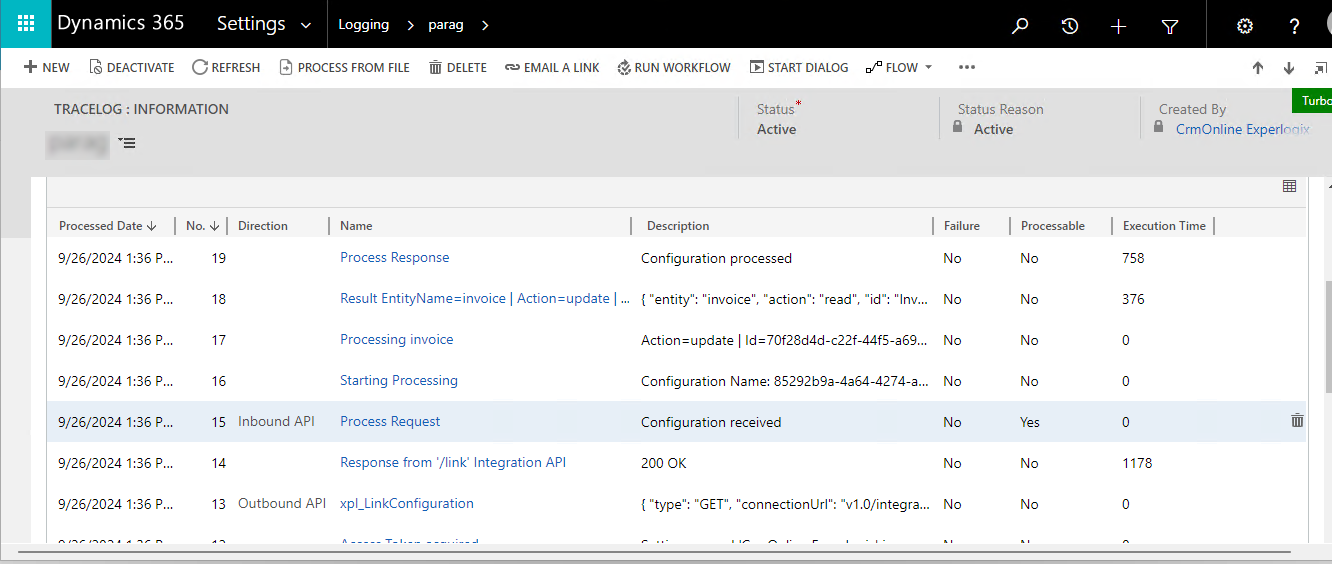
Microsoft Dynamics 365 CE Trace Log Settings
|
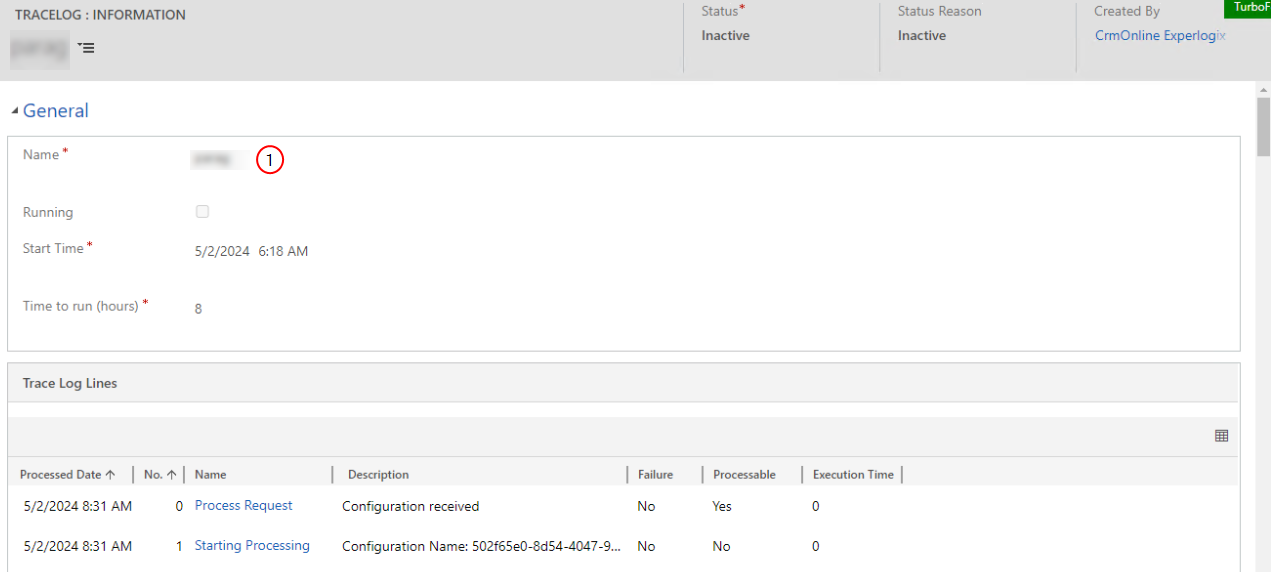
Field |
Description |
|||
|---|---|---|---|---|
|
Name |
Name of the trace log. |
|||
|
Running |
Select the checkbox to run the log. |
|||
|
Start Time |
Date and time when the log was activated. |
|||
|
Direction |
Direction of request (inbound or outbound). |
|||
|
Time to run (hours) |
The duration in hours for which the log will continue to run. |
|||
|
Processed Date |
Date and time when the particular log was processed. |
|||
|
Number (No.) |
Serial number of the log line. |
|||
|
Name |
Name of the log line. |
|||
|
Description |
Description of the log line. |
|||
|
Failure |
If Yes, the log was a failure. |
|||
|
Processable |
If Yes, the log can be processed. |
|||
|
Execution Time |
The time it takes to execute the log. It is displayed in milliseconds. |
|||
|
Direction |
|
Procedures
Access the Logging page
-
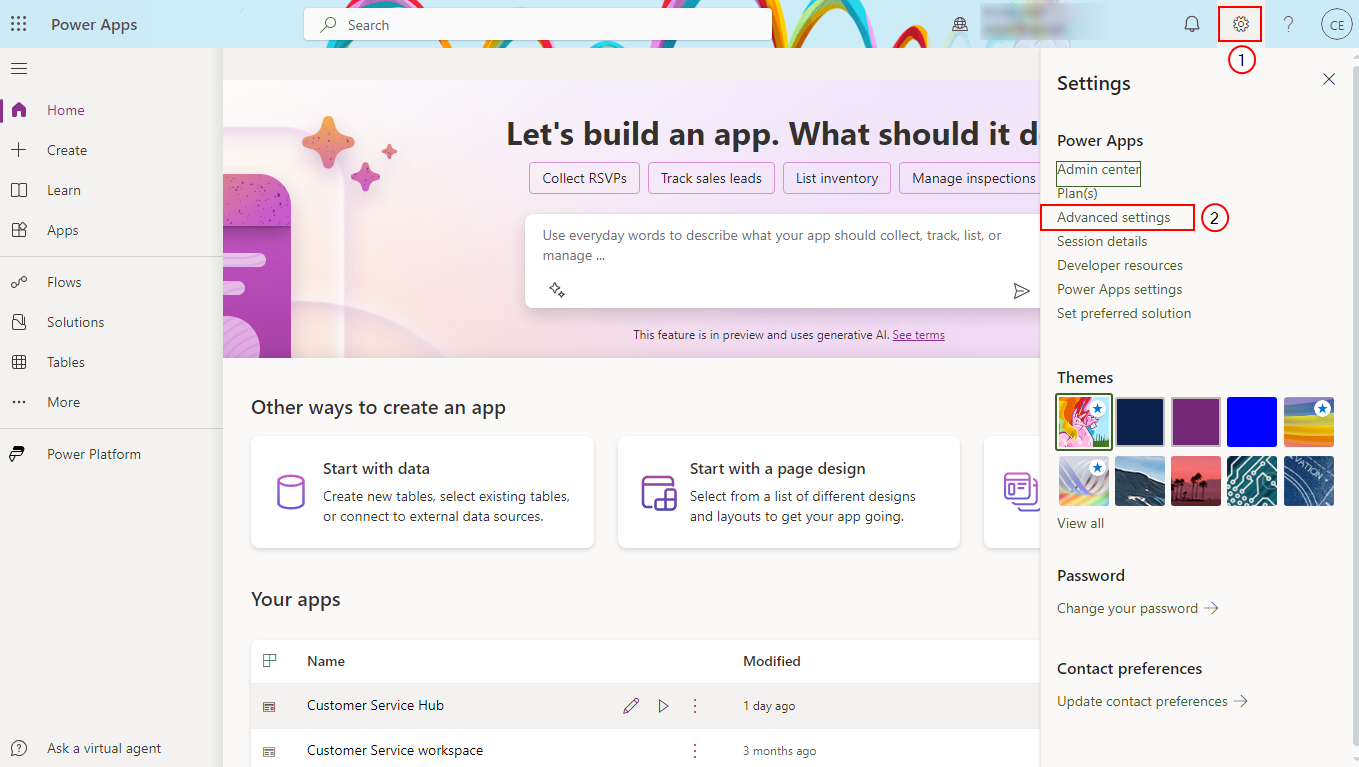
On the Microsoft Dynamics 365 CE home page, select the Settings icon in the screen's upper-right corner.
-
Select Advanced Settings.
-
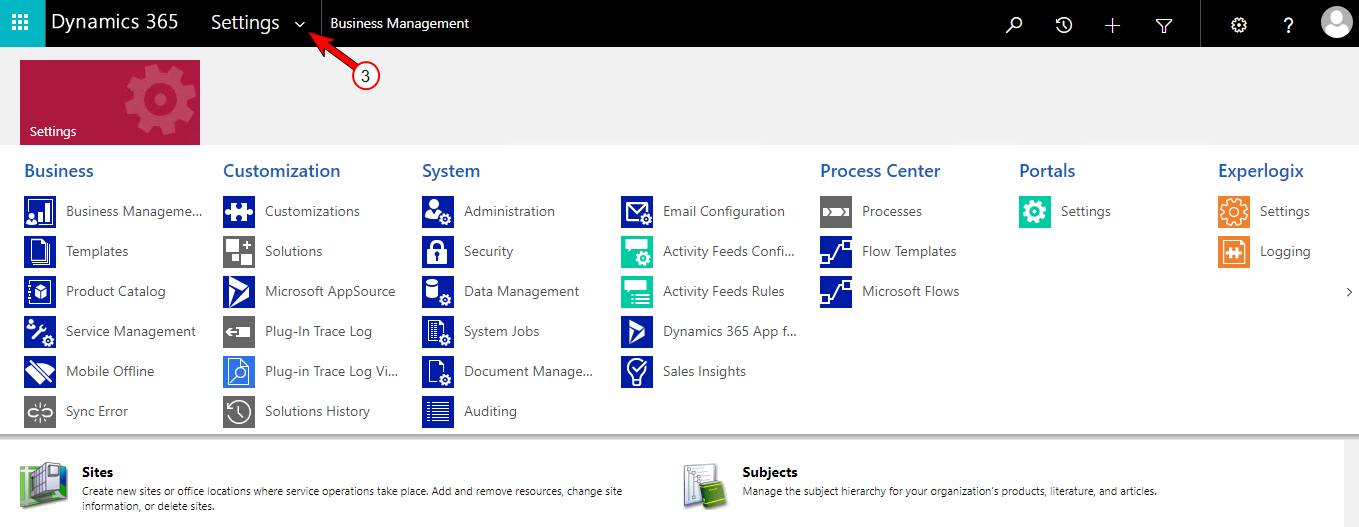
Select the Settings dropdown arrow at the upper-left corner to view the Settings options.
-
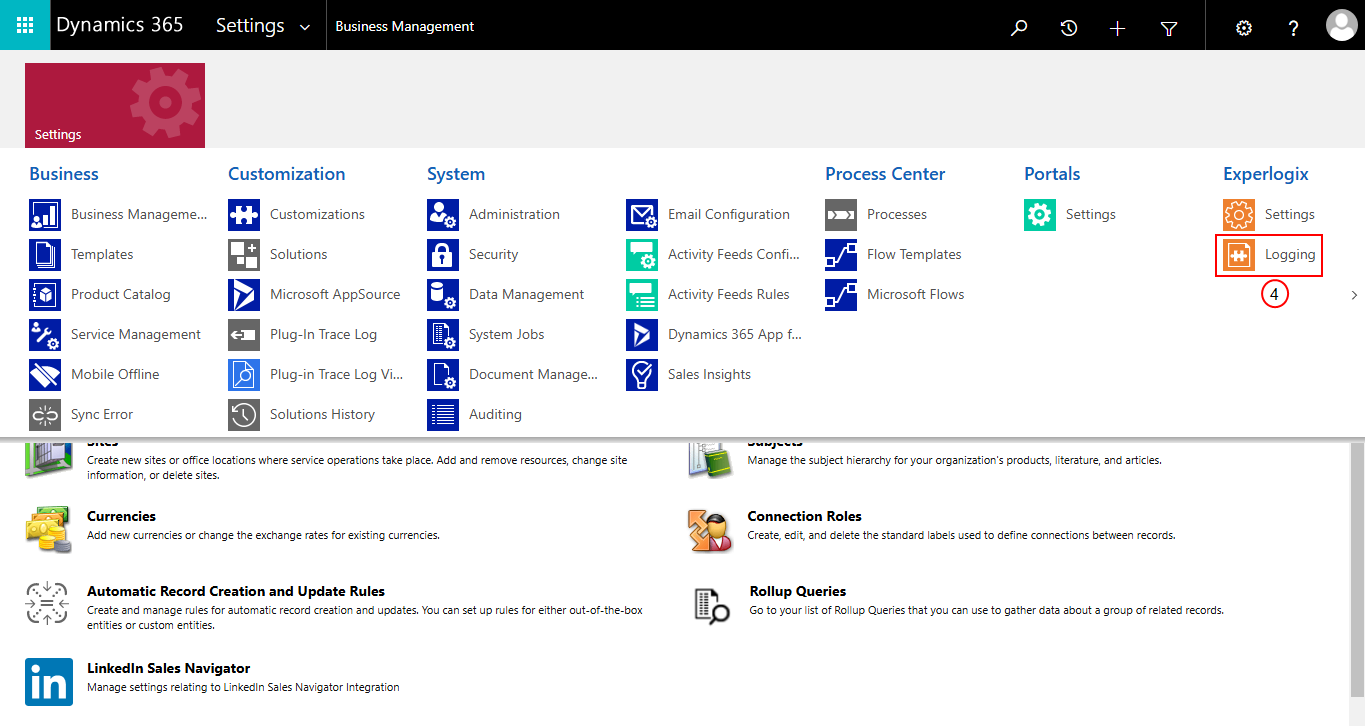
Under the Experlogix column, select Logging.
-
Select a Name to view the trace log.
Add a new trace log record
-
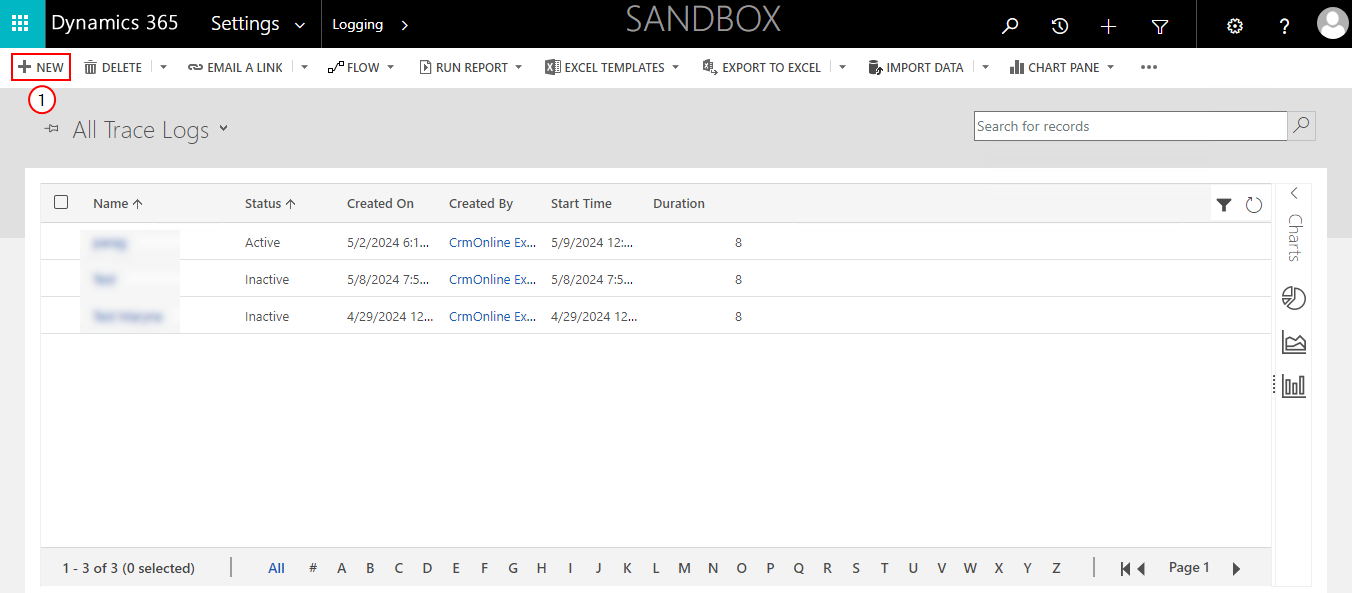
On the Trace log page, in the upper-left corner, select + NEW.
-
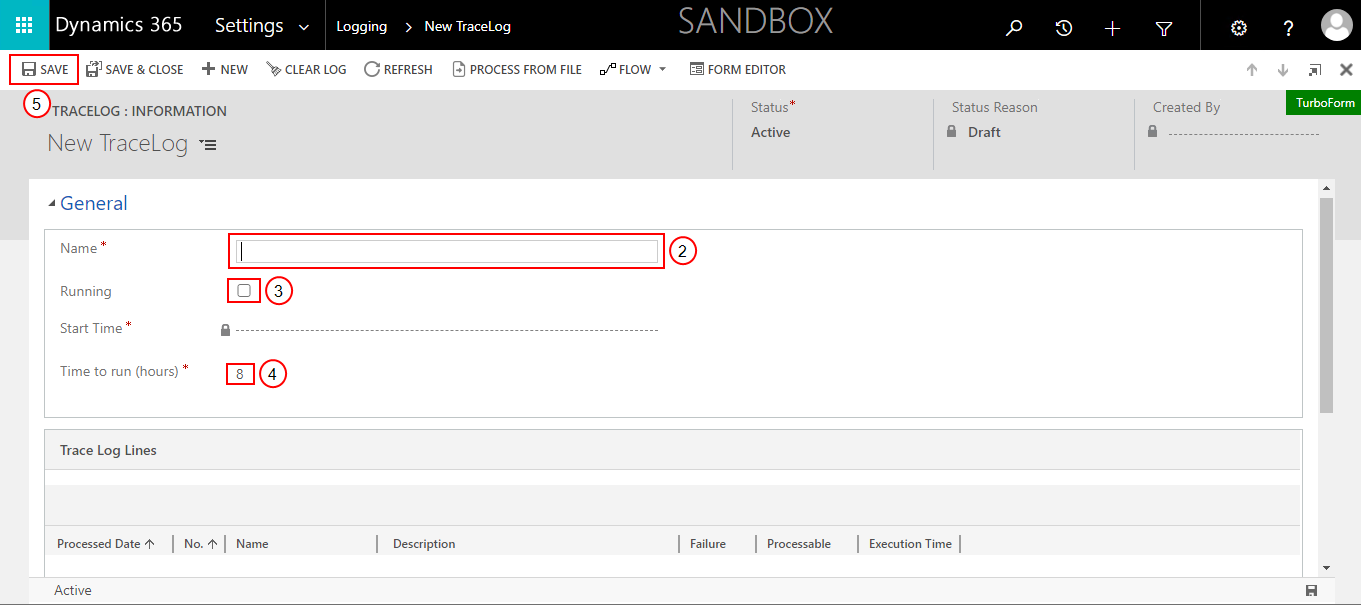
In the Name field, add the Trace Log name.
-
Select the Running checkbox to run the Trace Log after adding it.
The new Trace Log will not run if an existing Trace Log is active.
-
In the Time to run (hours) field, add the number of hours.
-
Select the Save button.
The Trace Log is saved and displayed on the All Trace Logs page.
Activate a trace log
-
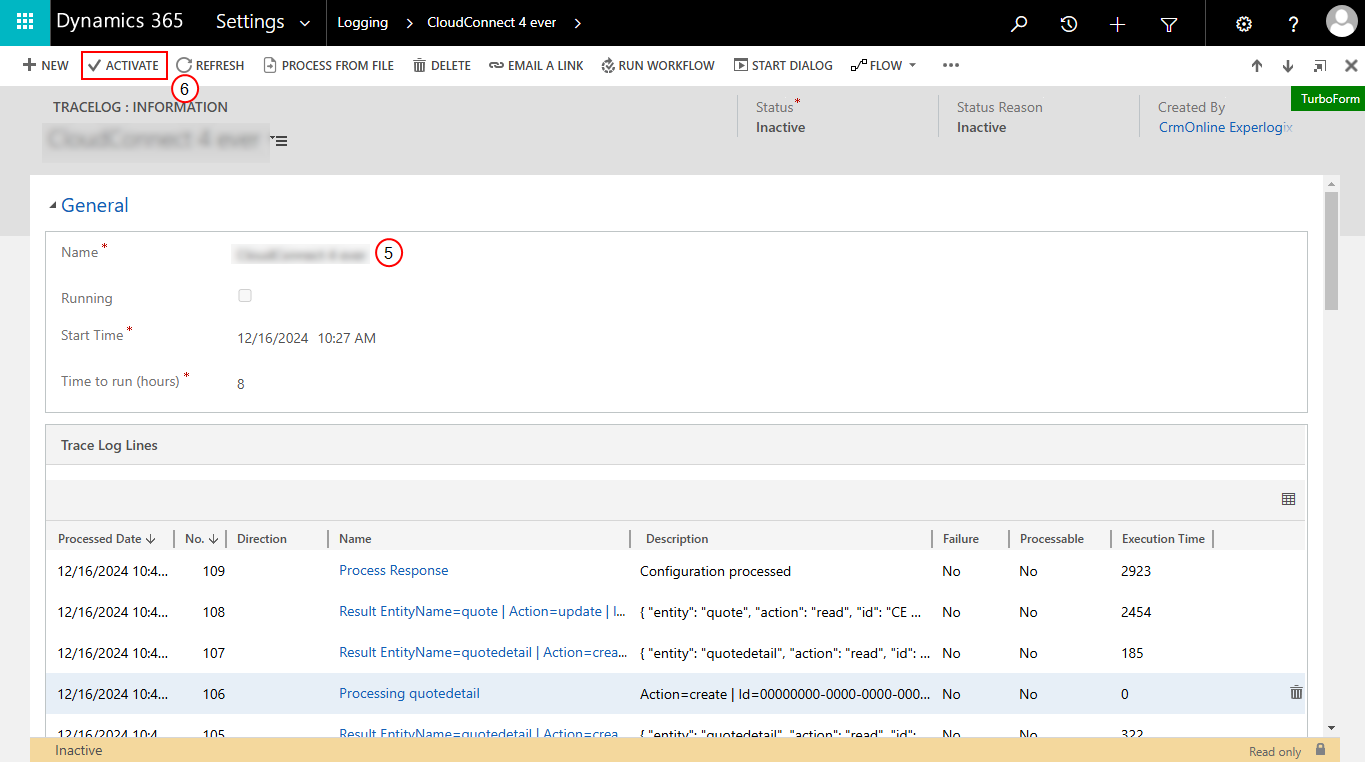
On the Trace log page, open the Trace Log you want to activate.
-
At the upper-left corner, select the ACTIVATE button.
The new Trace Log will not run if another Trace Log is active. Deactivate the active log, then activate the other log and select the Running checkbox.
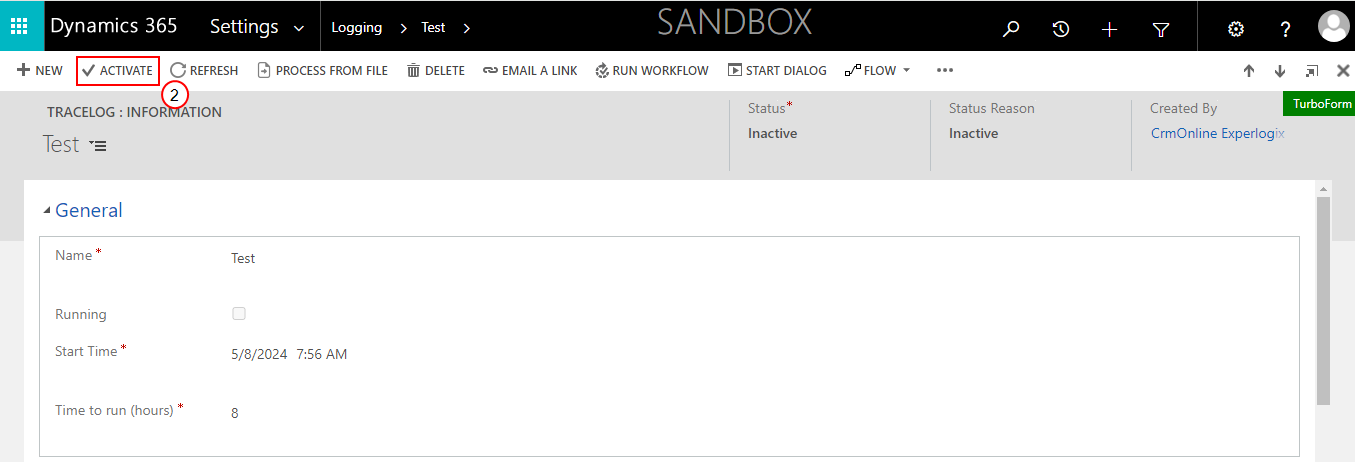
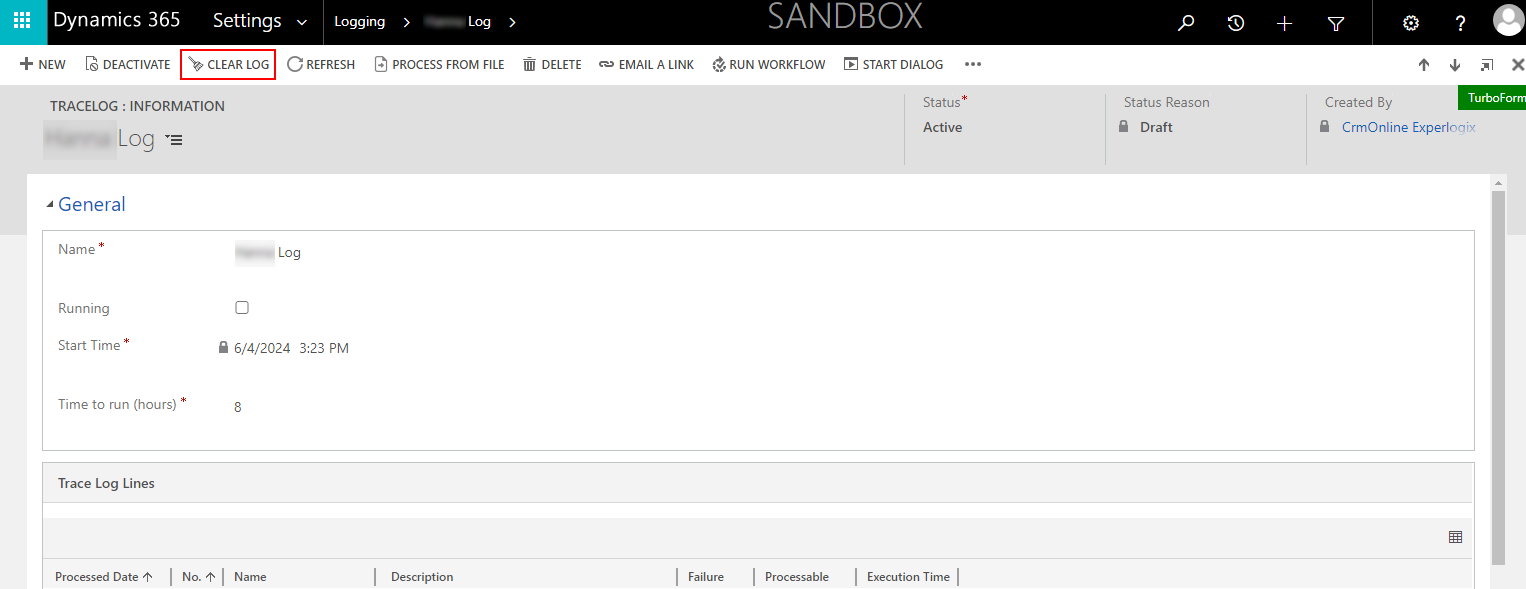
The Trace Log is activated.
After a running a log, you can use the CLEAR LOG button to remove existing log lines.
Review Log
-
On the Trace log page, select a Name to view the trace log.
-
Execute the process file.
-
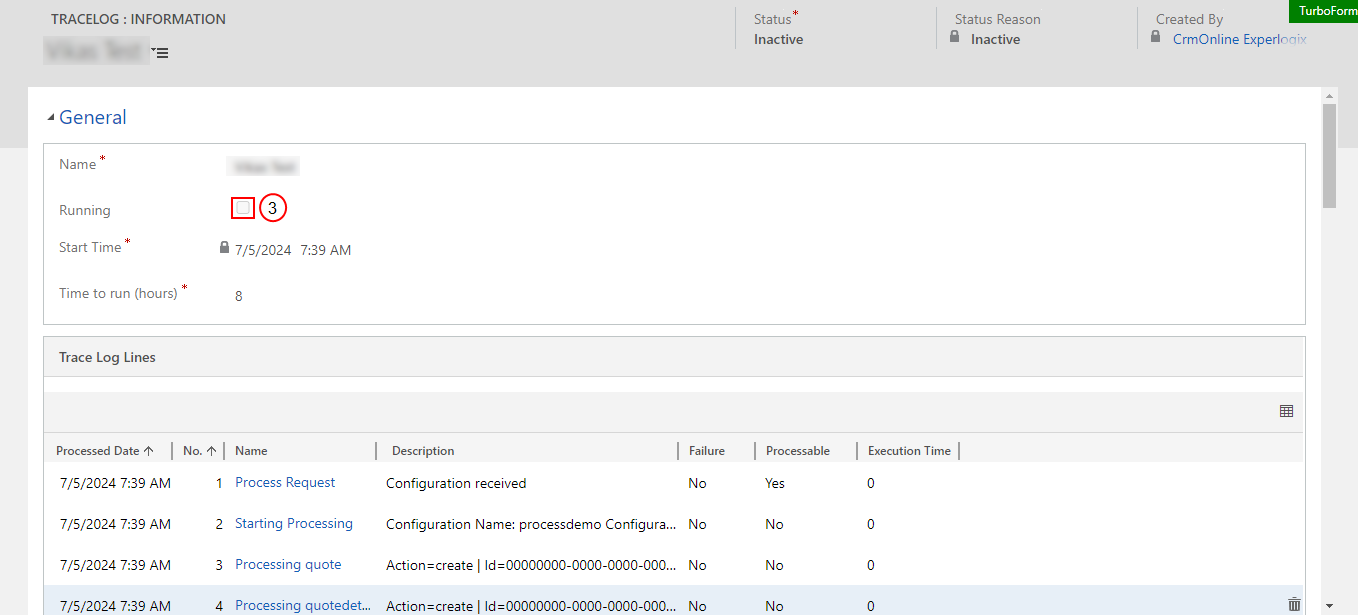
Select the Running checkbox .
-
Select REFRESH.
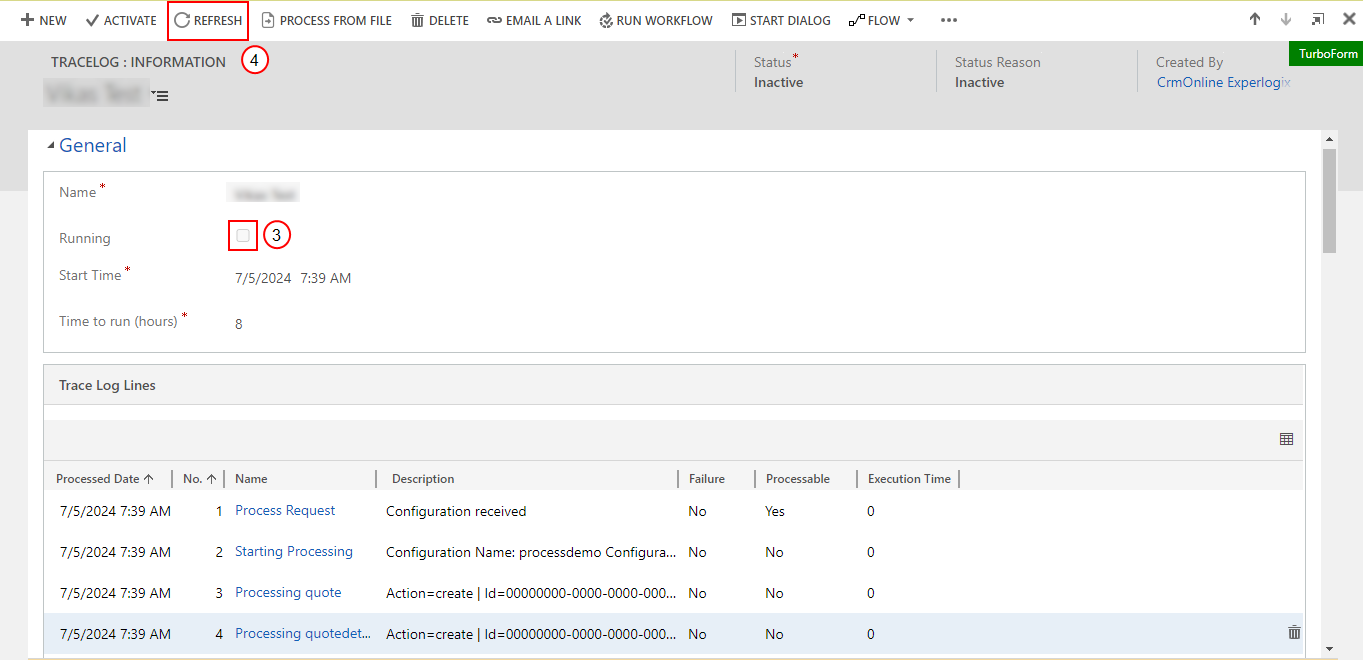
The trace log is generated.
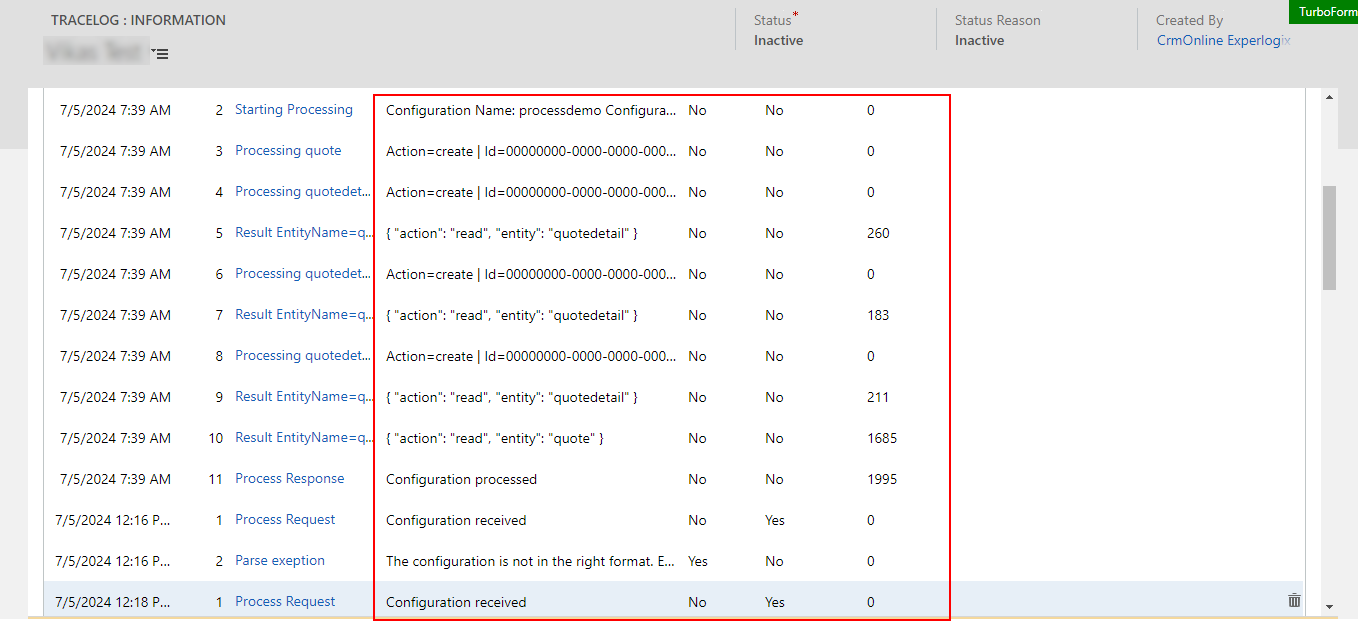
Processing log from a file
-
On the Trace log page, select a Name to view the trace log.
Only one file can be selected at a time.
-
Execute the process file.
-
Select Running.
-
Select REFRESH.
The trace log is generated.
-
Select PROCESS FROM FILE.
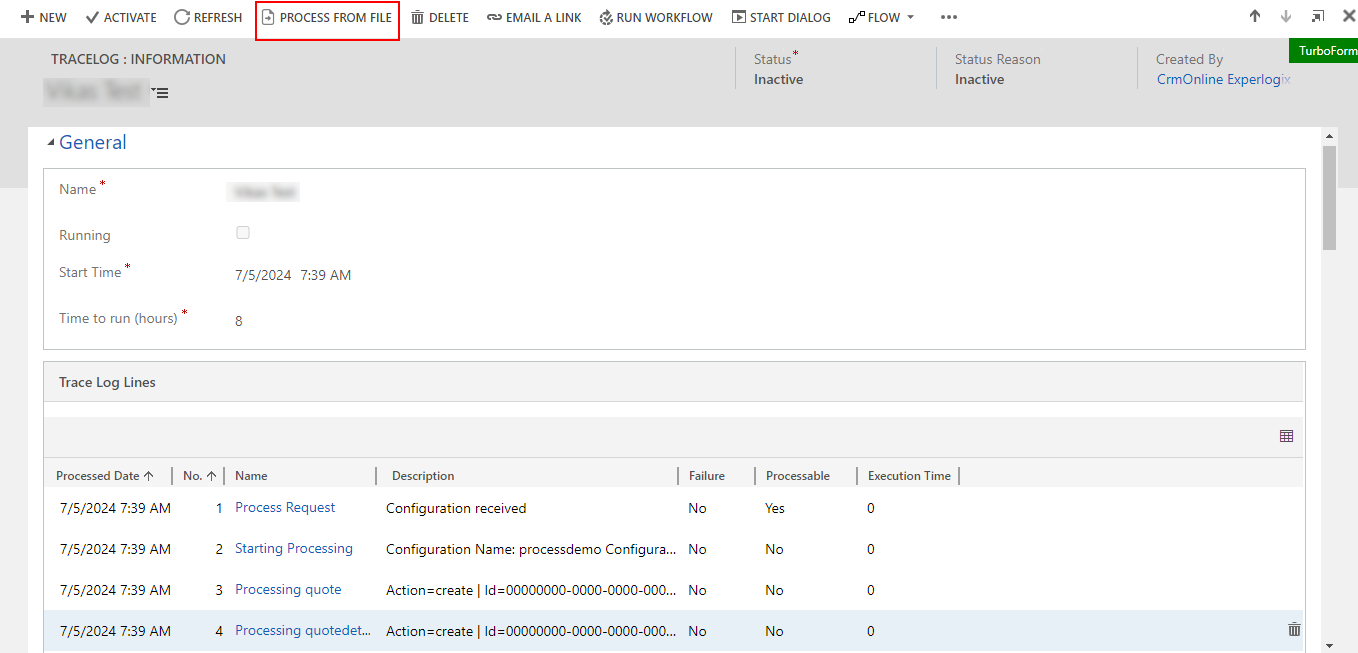
-
Upload the file to process.
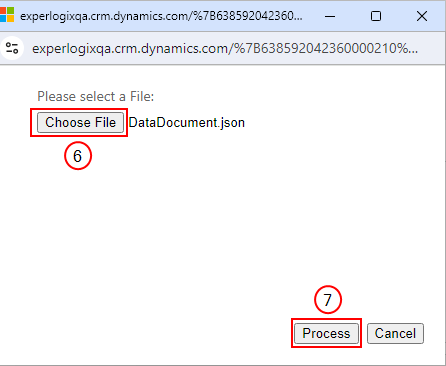
-
Select Process.
The log is processed.
When processing errors occur with the Microsoft Dynamics 365 CE Logger enabled, the system returns the error message in the Configurator/Integration. Due to technical limitations, the error does not appear in the CE Log.
Managing Outbound Logging
Activate outbound logging for HTTP requests and generate logs on quotes to enhance debugging and monitoring in Microsoft Dynamics 365 CE. This approach empowers developers and support teams to efficiently track and resolve issues.
Enable Outbound Logging
-
On the Microsoft Dynamics 365 CE home page, select the Settings icon in the screen's upper-right corner.
-
Select Advanced Settings.
-
Select the Settings dropdown arrow at the upper-left corner to view the Settings options.
-
Under the Experlogix column, select Logging.
-
Select a Name to view the trace log.
-
Select ACTIVATE.
-
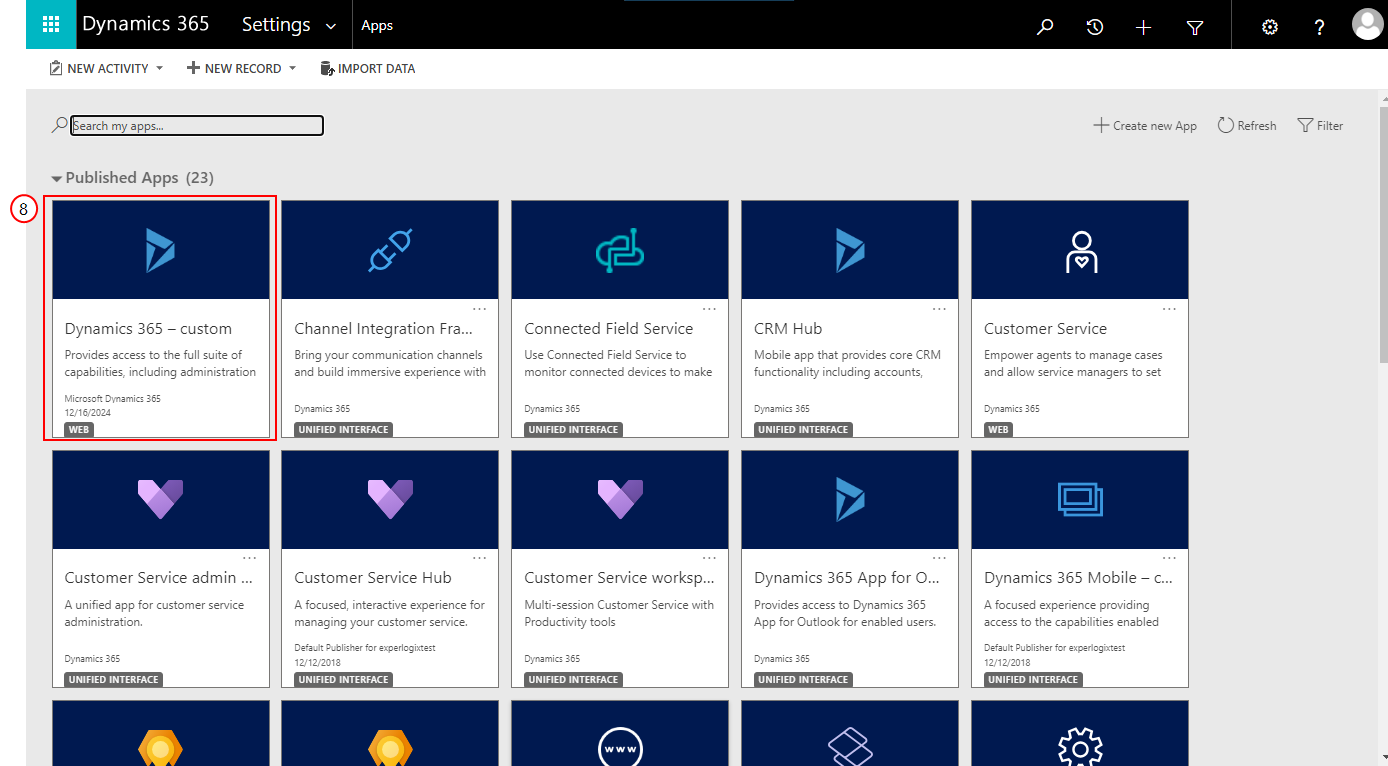
Under Settings select Apps.
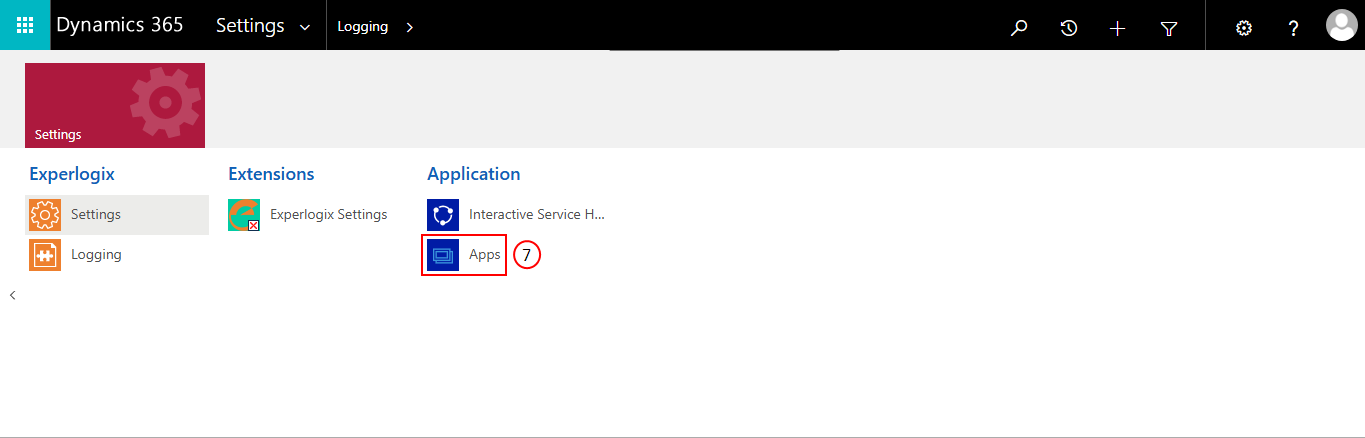
-
Select Dynamics 365 - custom.
-
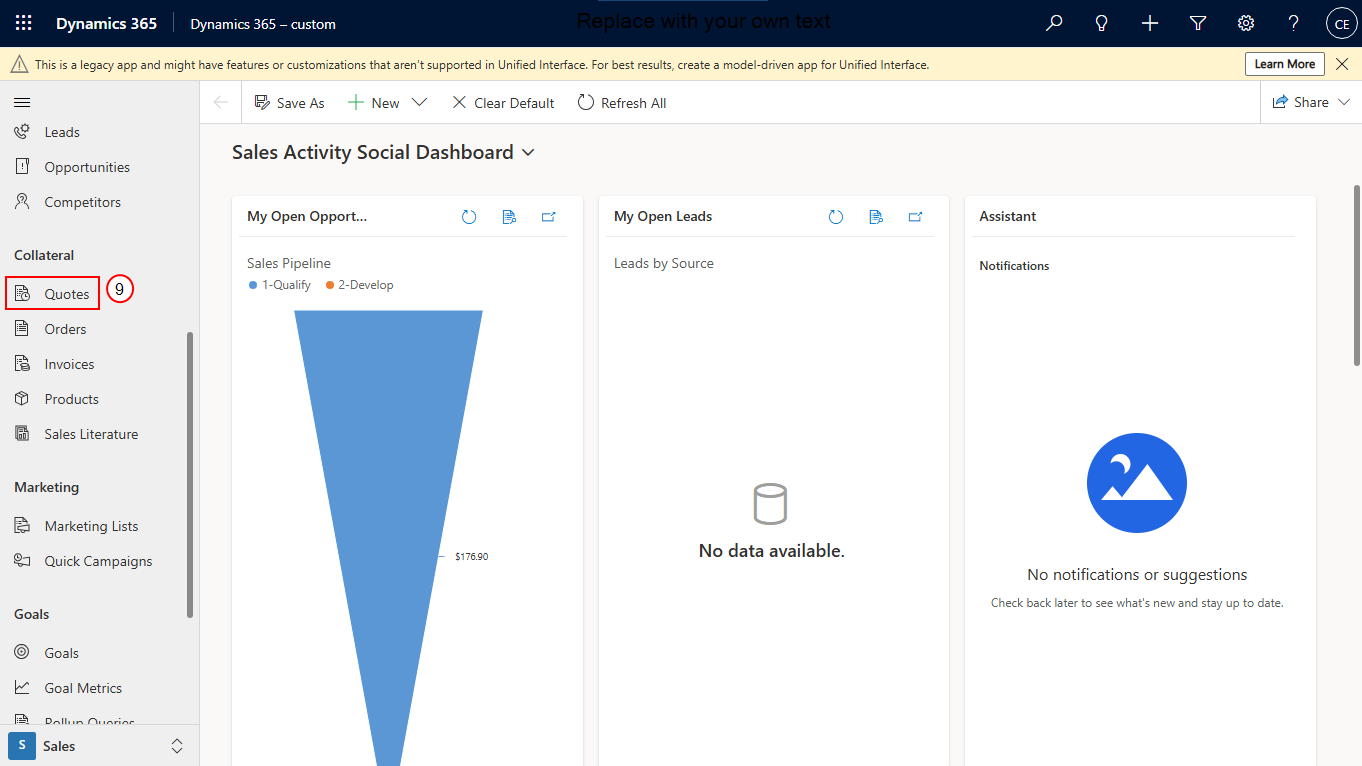
Under Collateral, select Quotes.
-
Activate and revise a Quote.
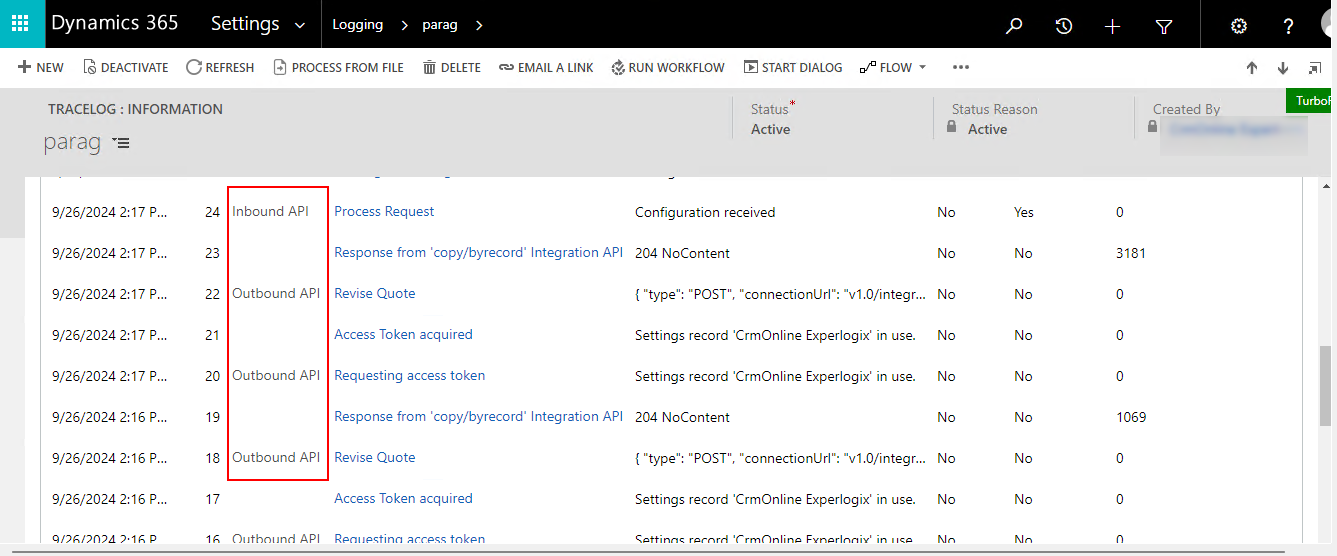
The outbound logs are generated.