
In Experlogix, logging is a mechanism to log the incoming and outgoing requests between Cloud Connect and the Configurator. It also helps get insight into information processing in Microsoft Dynamics 365 F&O. This topic details the request types and steps for accessing the Microsoft Dynamics 365 F&O Logging form.
There are currently five types of requests that can be logged:
|
Request Type |
Description |
Example |
|---|---|---|
|
Query |
Requests to retrieve data from host-system. |
A sales price from trade agreements or the description for an item number. |
|
Metadata |
Requests to find all or specific entities, their attributes, fields, and relations to other entities. |
Retrieve all fields/attributes/relations from 27 (Item) entities. |
|
Process |
Requests to create information in the host-system. |
Create an item, BOM, and/or route in Microsoft Dynamics 365 F&O based on setup in Process Designer and selected Options in the Configurator. |
|
Details |
Detailed logging for requests and responses between Experlogix and Microsoft Dynamics 365 F&O. |
Log individual requests and responses. |
|
BOM/Route Generator |
Requests related to the creation of BOM and Routes after a configuration is processed. |
Create a BOM after saving a configuration to Microsoft Dynamics 365 F&O. |
Log/Trace Settings
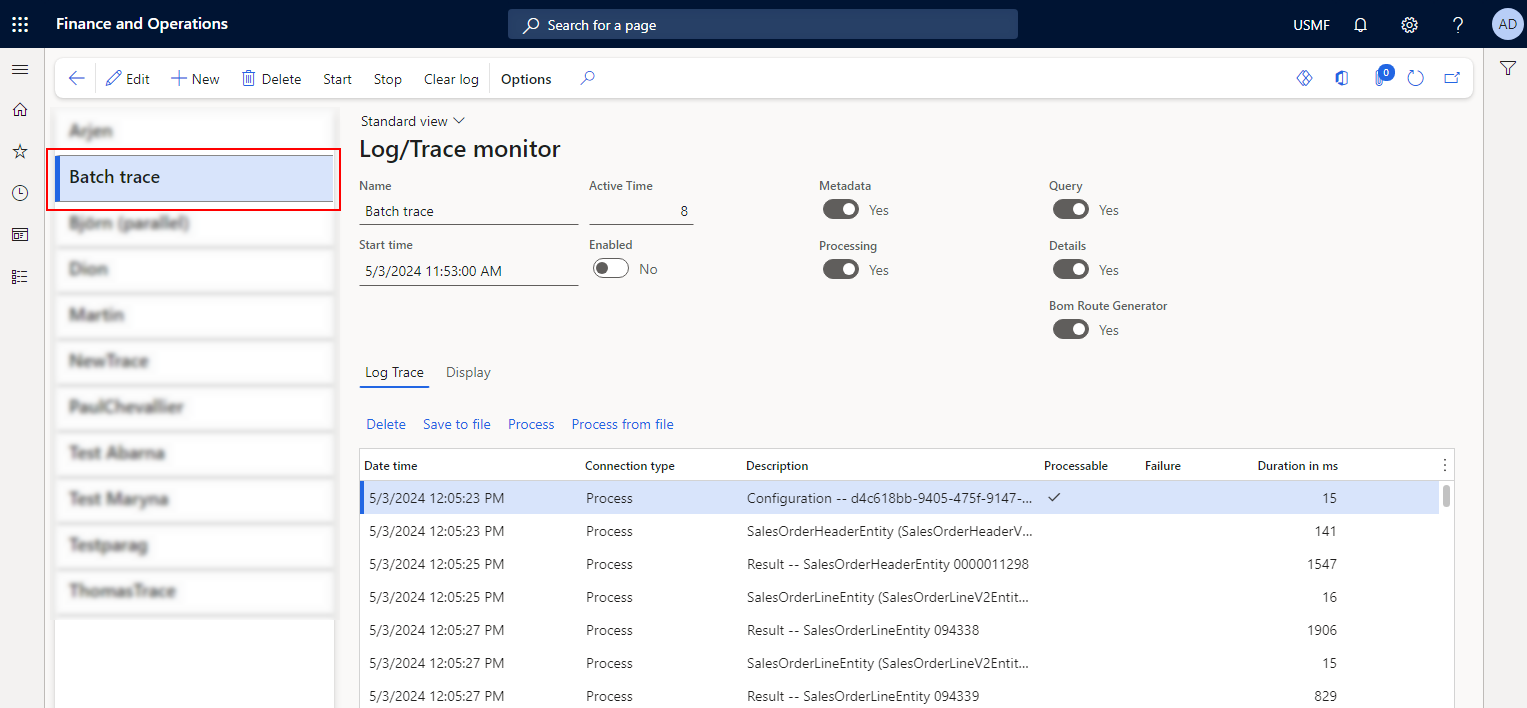
The following table describes the options and fields available on the Log/Trace page for Microsoft Dynamics 365 F&O:
|
Field |
Description |
|---|---|
|
Name |
Name of the selected log/trace. |
|
Active Time |
The duration in hours that the log will run. |
|
Start time |
Date and time the log was activated. |
|
Enabled |
Select to enable the log/trace. |
|
Metadata |
If yes, logs Metadata requests. |
|
Query |
If yes, logs query requests. |
|
Processing |
If yes, logs processing requests. |
|
Details |
If yes, logs details requests. |
|
Bom Route Generator |
If yes, logs BOM/route generation requests. |
Log Record Details
The body of the logs feature the information below:
|
Field |
Description |
|---|---|
|
Date time |
Date and time when the particular log record was processed. |
|
Connection type |
The connection type of the log. |
|
Description |
Description for the log line. |
|
Direction |
Indicates if the request was inbound or outbound, if applicable. |
|
Processable |
If checked, the log record can be processed. |
|
Failure |
If checked, the log record included a failure. |
|
Duration in ms |
The time taken to execute the action in the record. It is displayed in milliseconds. |
Procedures
Access the Logging Page
-
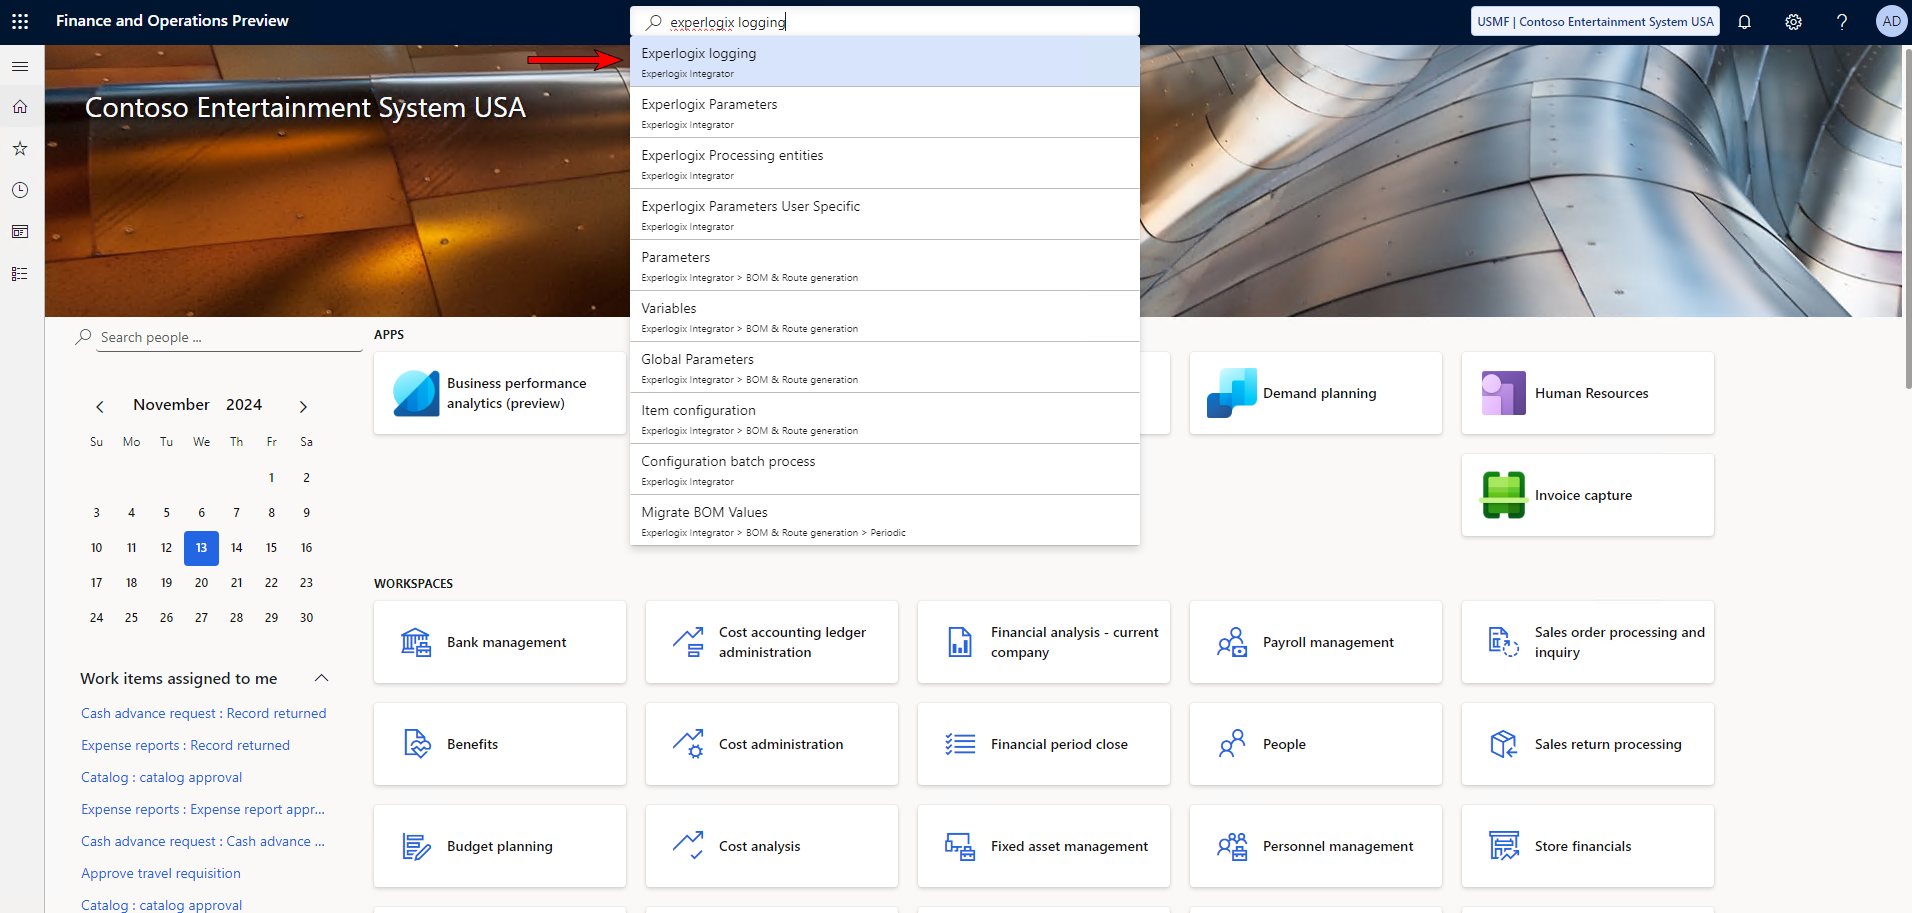
In Microsoft Dynamics 365 F&O search, search for and select Experlogix Logging.
-
Select a record to view the log or trace details.
Add a New Trace Log Record
-
In Microsoft Dynamics 365 F&O search, search for and select Experlogix Logging.
-
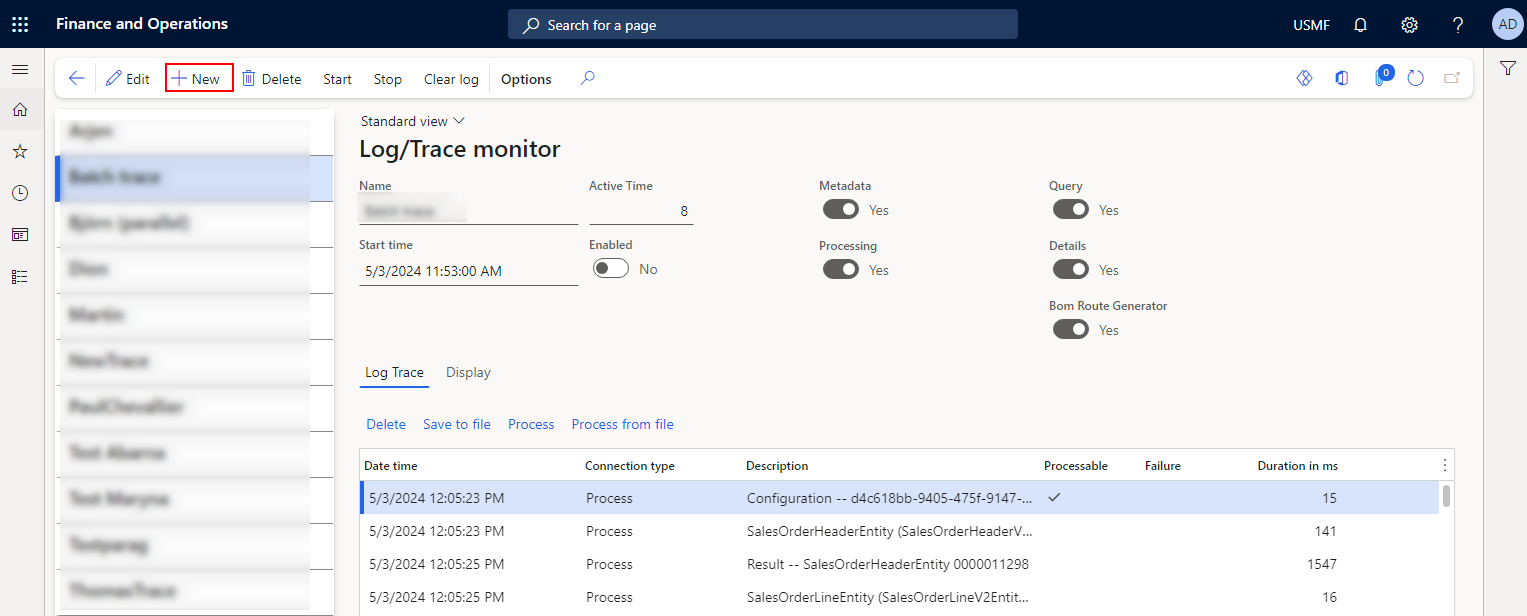
At the upper-left corner, select + New.
-
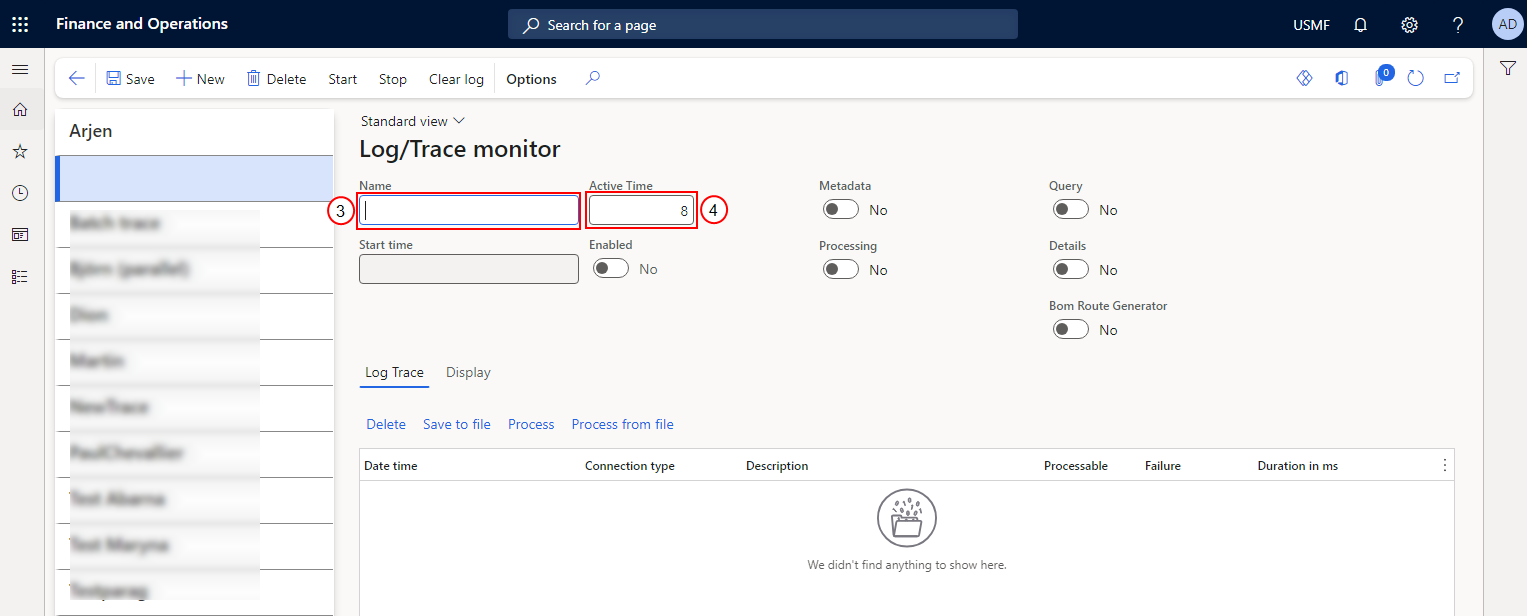
In the Name field, enter a name for the log.
-
In the Active Time field, enter the number of hours for which you want the log to be active.
The maximum time for which the log can be kept active is eight hours.
-
Select the connection types for which you want to include the entries in the log.
-
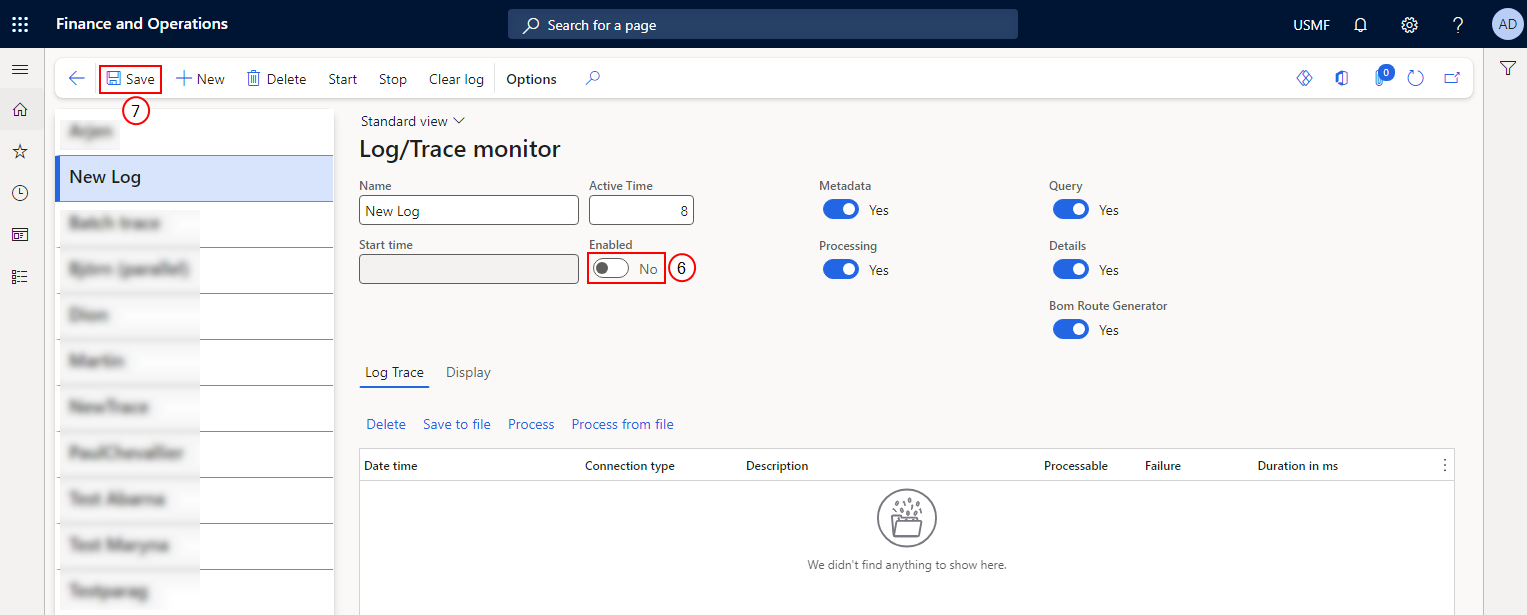
Select the Enabled option to enable the log monitor.
-
Select the Save button.
-
Select the Start button to start the log.
The log does not start if another log is already active. Stop the active log and then try starting the new log. Only one log can run at a time.
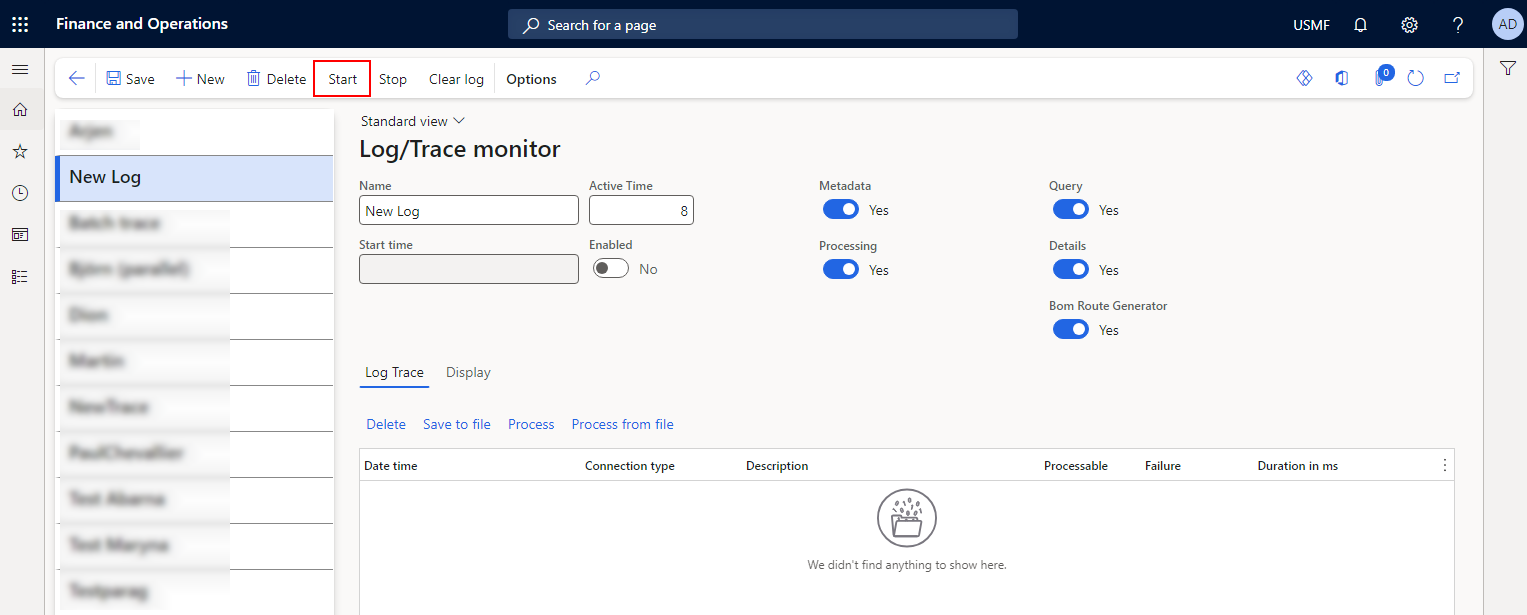
The logging starts and the log lines display.
Clear Log Lines
-
In Microsoft Dynamics 365 F&O search, search for and select Experlogix Logging. The Log/Trace monitor page displays.
-
At the top, select Clear log.
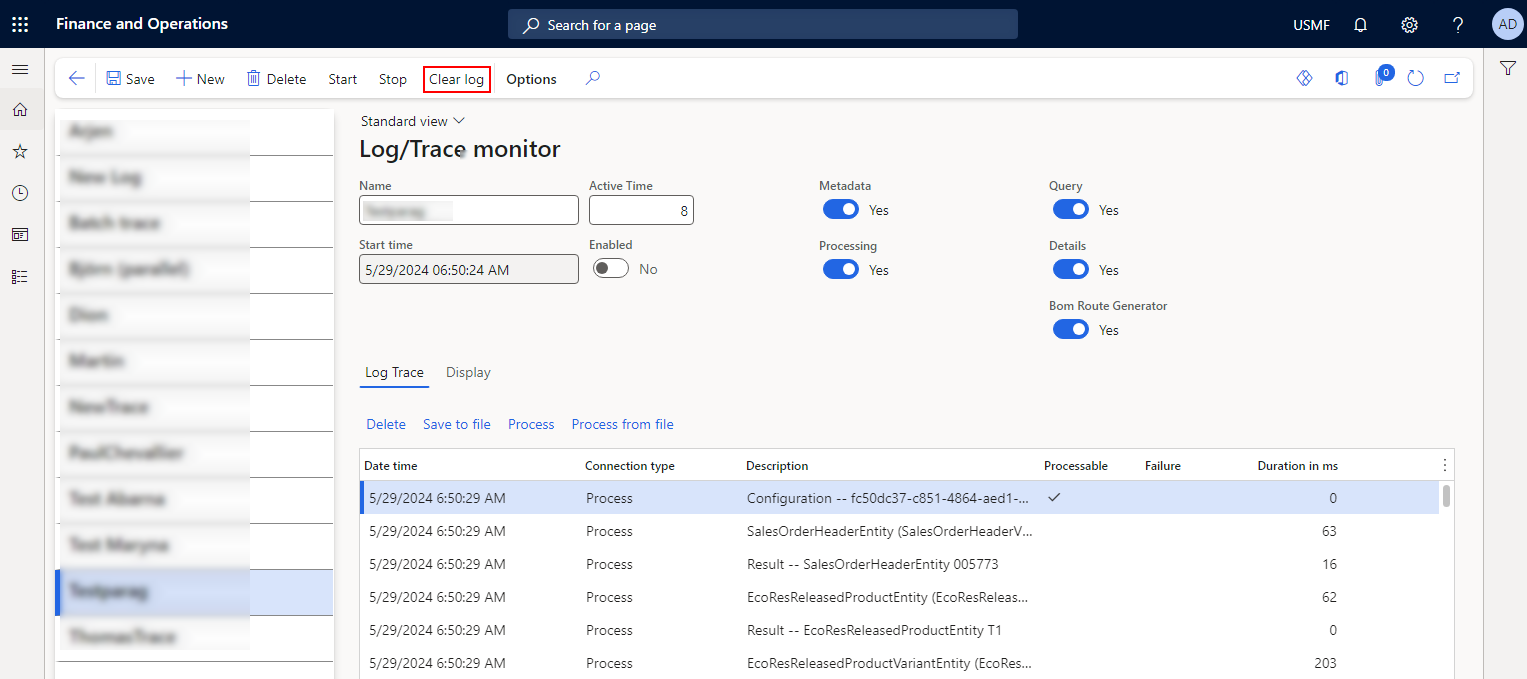
The log lines are cleared.