
In Experlogix, logging is a mechanism to log the incoming and outgoing connections between Cloud Connect and the Configurator. It also helps get insight into information processing in Microsoft Dynamics 365 BC. This topic details the connection types and steps for accessing the Microsoft Dynamics 365 BC Logging form, and details about the new Experlogix Trace Lines.
Connection Types
Users can create one-to-many logs or traces, but only one type (processing, query, or metadata) of log can be active at any time. There are currently four types of connections between Experlogix and Microsoft Dynamics 365 BC:
|
Connection Type |
Description |
Example |
|---|---|---|
|
Query |
Request to retrieve data from the host-system |
A salesprice from the trade agreements or the description for an item number. |
|
Metadata |
Request to find all or specific entities, their attributes, fields, and relations to other entities |
Retrieve all fields/attributes/relations from 27 (Item) entities. |
|
Process |
Request to create information in the host-system |
Create an item, BOM, and route in Microsoft Dynamics 365 BC based on setup in Process Designer and selected Options in the Configurator. |
|
Details |
Enable detailed logging |
Log individual requests and responses. |
Access the Logging page
-
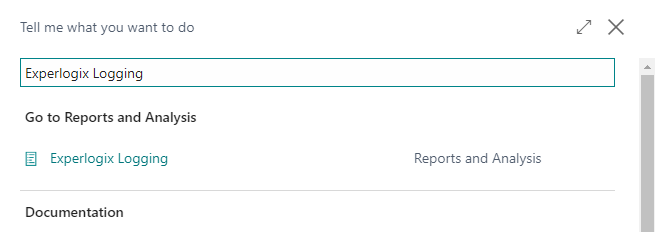
On the Microsoft Dynamics 365 BC home page, at the upper-right corner of the screen, select the Search icon.

-
In the Search field, type Experlogix logging.
-
From the displayed options, select Experlogix Logging.
The Experlogix Logging page displays, listing the existing logs.
-
Select the Log name to view the logging details.
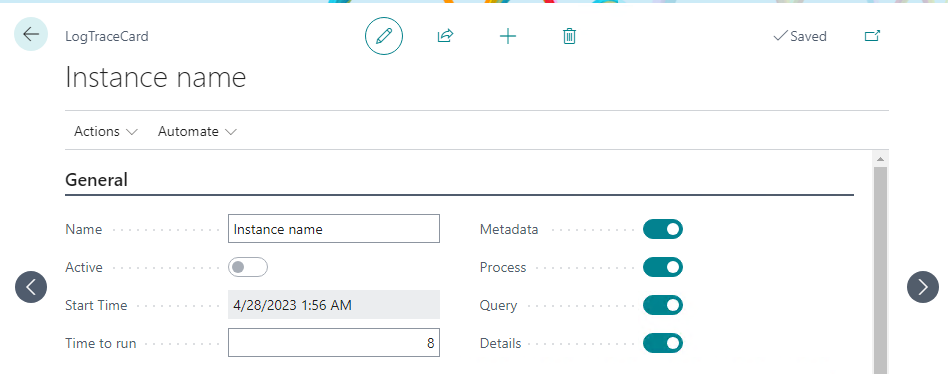
The following table describes the options and fields available on the Log Trace Card page:
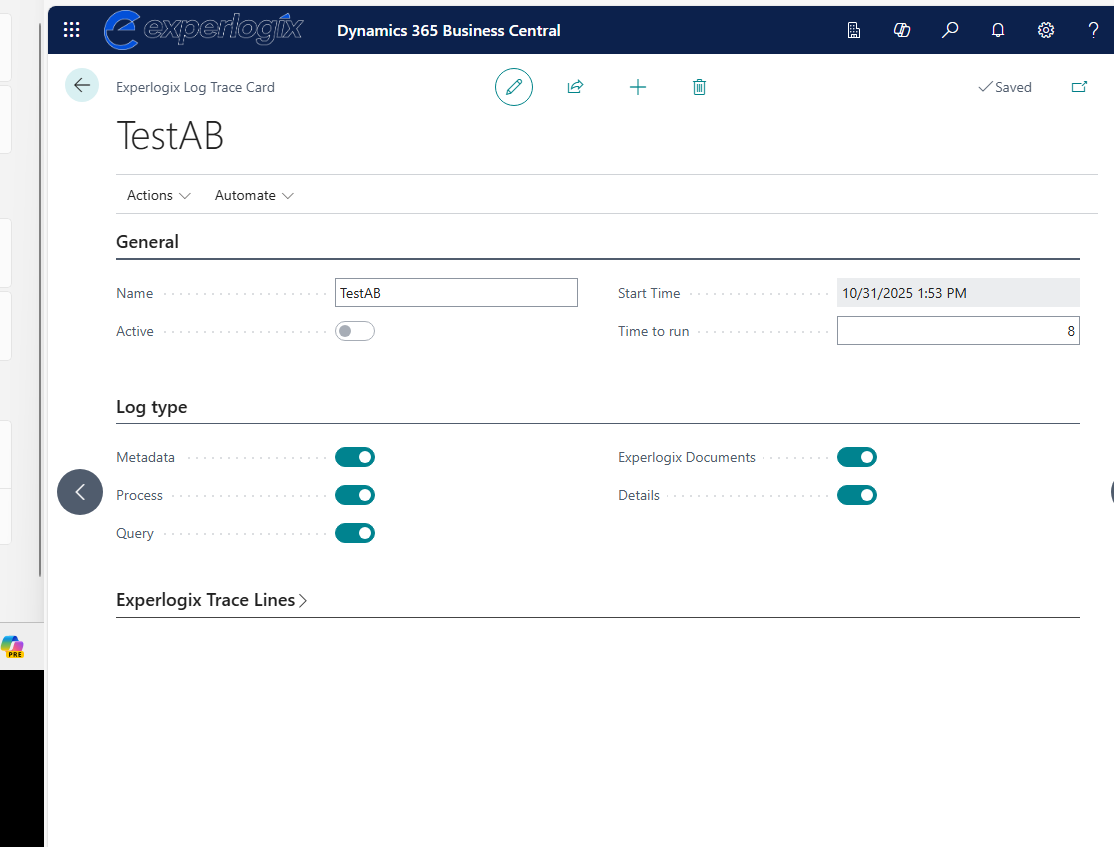
|
Field |
Description |
||||||||
|---|---|---|---|---|---|---|---|---|---|
|
Action |
Options available for logging:
|
||||||||
|
Active |
Select to indicate that the trace is active. |
||||||||
|
Start time |
Date and time when the trace was last started. |
||||||||
|
Time to run |
Time in hours that the trace will be turned on. |
||||||||
|
Processing |
Select to indicate if the process tracing is complete. |
||||||||
|
Query |
Select to view the log for completed Query tracing. |
||||||||
|
Metadata |
Select to view the log for completed Metadata tracing. |
||||||||
|
Details |
Select to view the log for completed Details tracing. Relevant if Processing is enabled. |
Experlogix Trace Lines
The Trace Lines section provides granular visibility into individual connection transactions during logging. Each trace line represents a single connection and its associated data. Review each line to analyze connection flow, success/failure patterns, and troubleshoot errors.
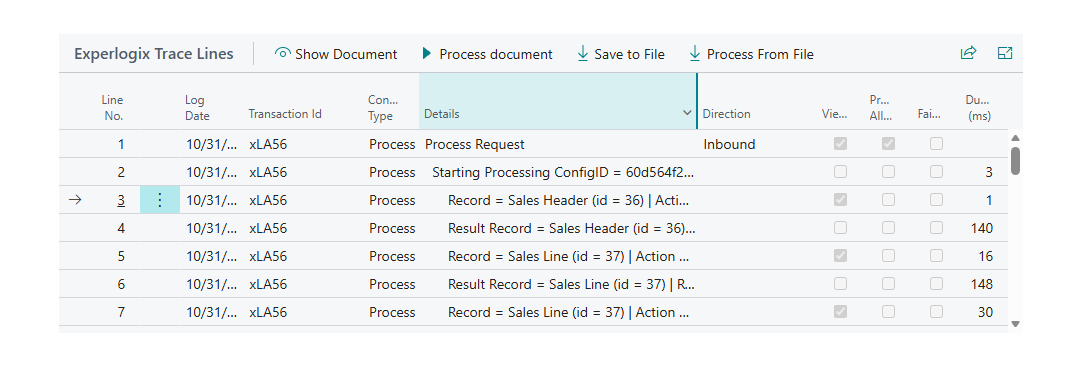
Trace Line Fields
|
Field |
Description |
|
|---|---|---|
|
Line No |
Sequential number of the trace entry in the log. |
|
|
Log Date |
Date and time when the connection was logged. |
|
|
Transaction ID |
Unique identifier for the connection. |
|
|
Connection Type |
Indicates the type of connection(e.g., Process, Query, Metadata). |
|
|
Details |
Log information details such as each API call made during a process request. |
|
|
Direction |
Enum field that indicates the flow of the connection:
|
|
|
Viewable |
Indicates whether the connection type allows the data to be viewed in JSON format. |
|
|
Process Allowed |
Indicates if the current connection is eligible for reprocessing using the Process Document button. |
|
|
Failure |
Status of the connection(e.g., success or failure). |
|
|
Duration (ms) |
Time taken to complete the step in milliseconds. |
Experlogix Trace Lines Procedures
The Trace Lines section includes several interactive buttons and table-level features that allow users to view, process, and manage trace data efficiently.
|
Button |
Description |
|---|---|
|
Show Document |
Displays the detailed JSON document for the selected trace line. Use this to inspect request and response payloads. |
|
Process Document |
Reprocesses the selected trace line. Useful for retrying failed transactions or validating changes. |
|
Save to File |
Exports the trace line details to a file for offline analysis or record-keeping. |
|
Process From File |
Allows processing of a previously saved trace file. Helpful for restoring or re-running logged operations. |
|
Focus Mode |
Expands the Trace Lines section into a full-page view, hiding other UI elements. This mode is ideal for analyzing trace data without distractions. |
Filtering and Sorting
The Trace Lines table supports:
-
Column-based Sorting: Select any column header (e.g., Log Date, Connection Type, Duration) to sort entries in ascending or descending order.
-
Field-based Filtering: Apply filters to narrow down trace lines by specific criteria.